Make sense of
your code.

Why is that outlet on? ABE adds a real-time debugger to Fusion's code editor — and a reference explorer so you can see exactly what's affecting what.

See exactly what your code is doing.

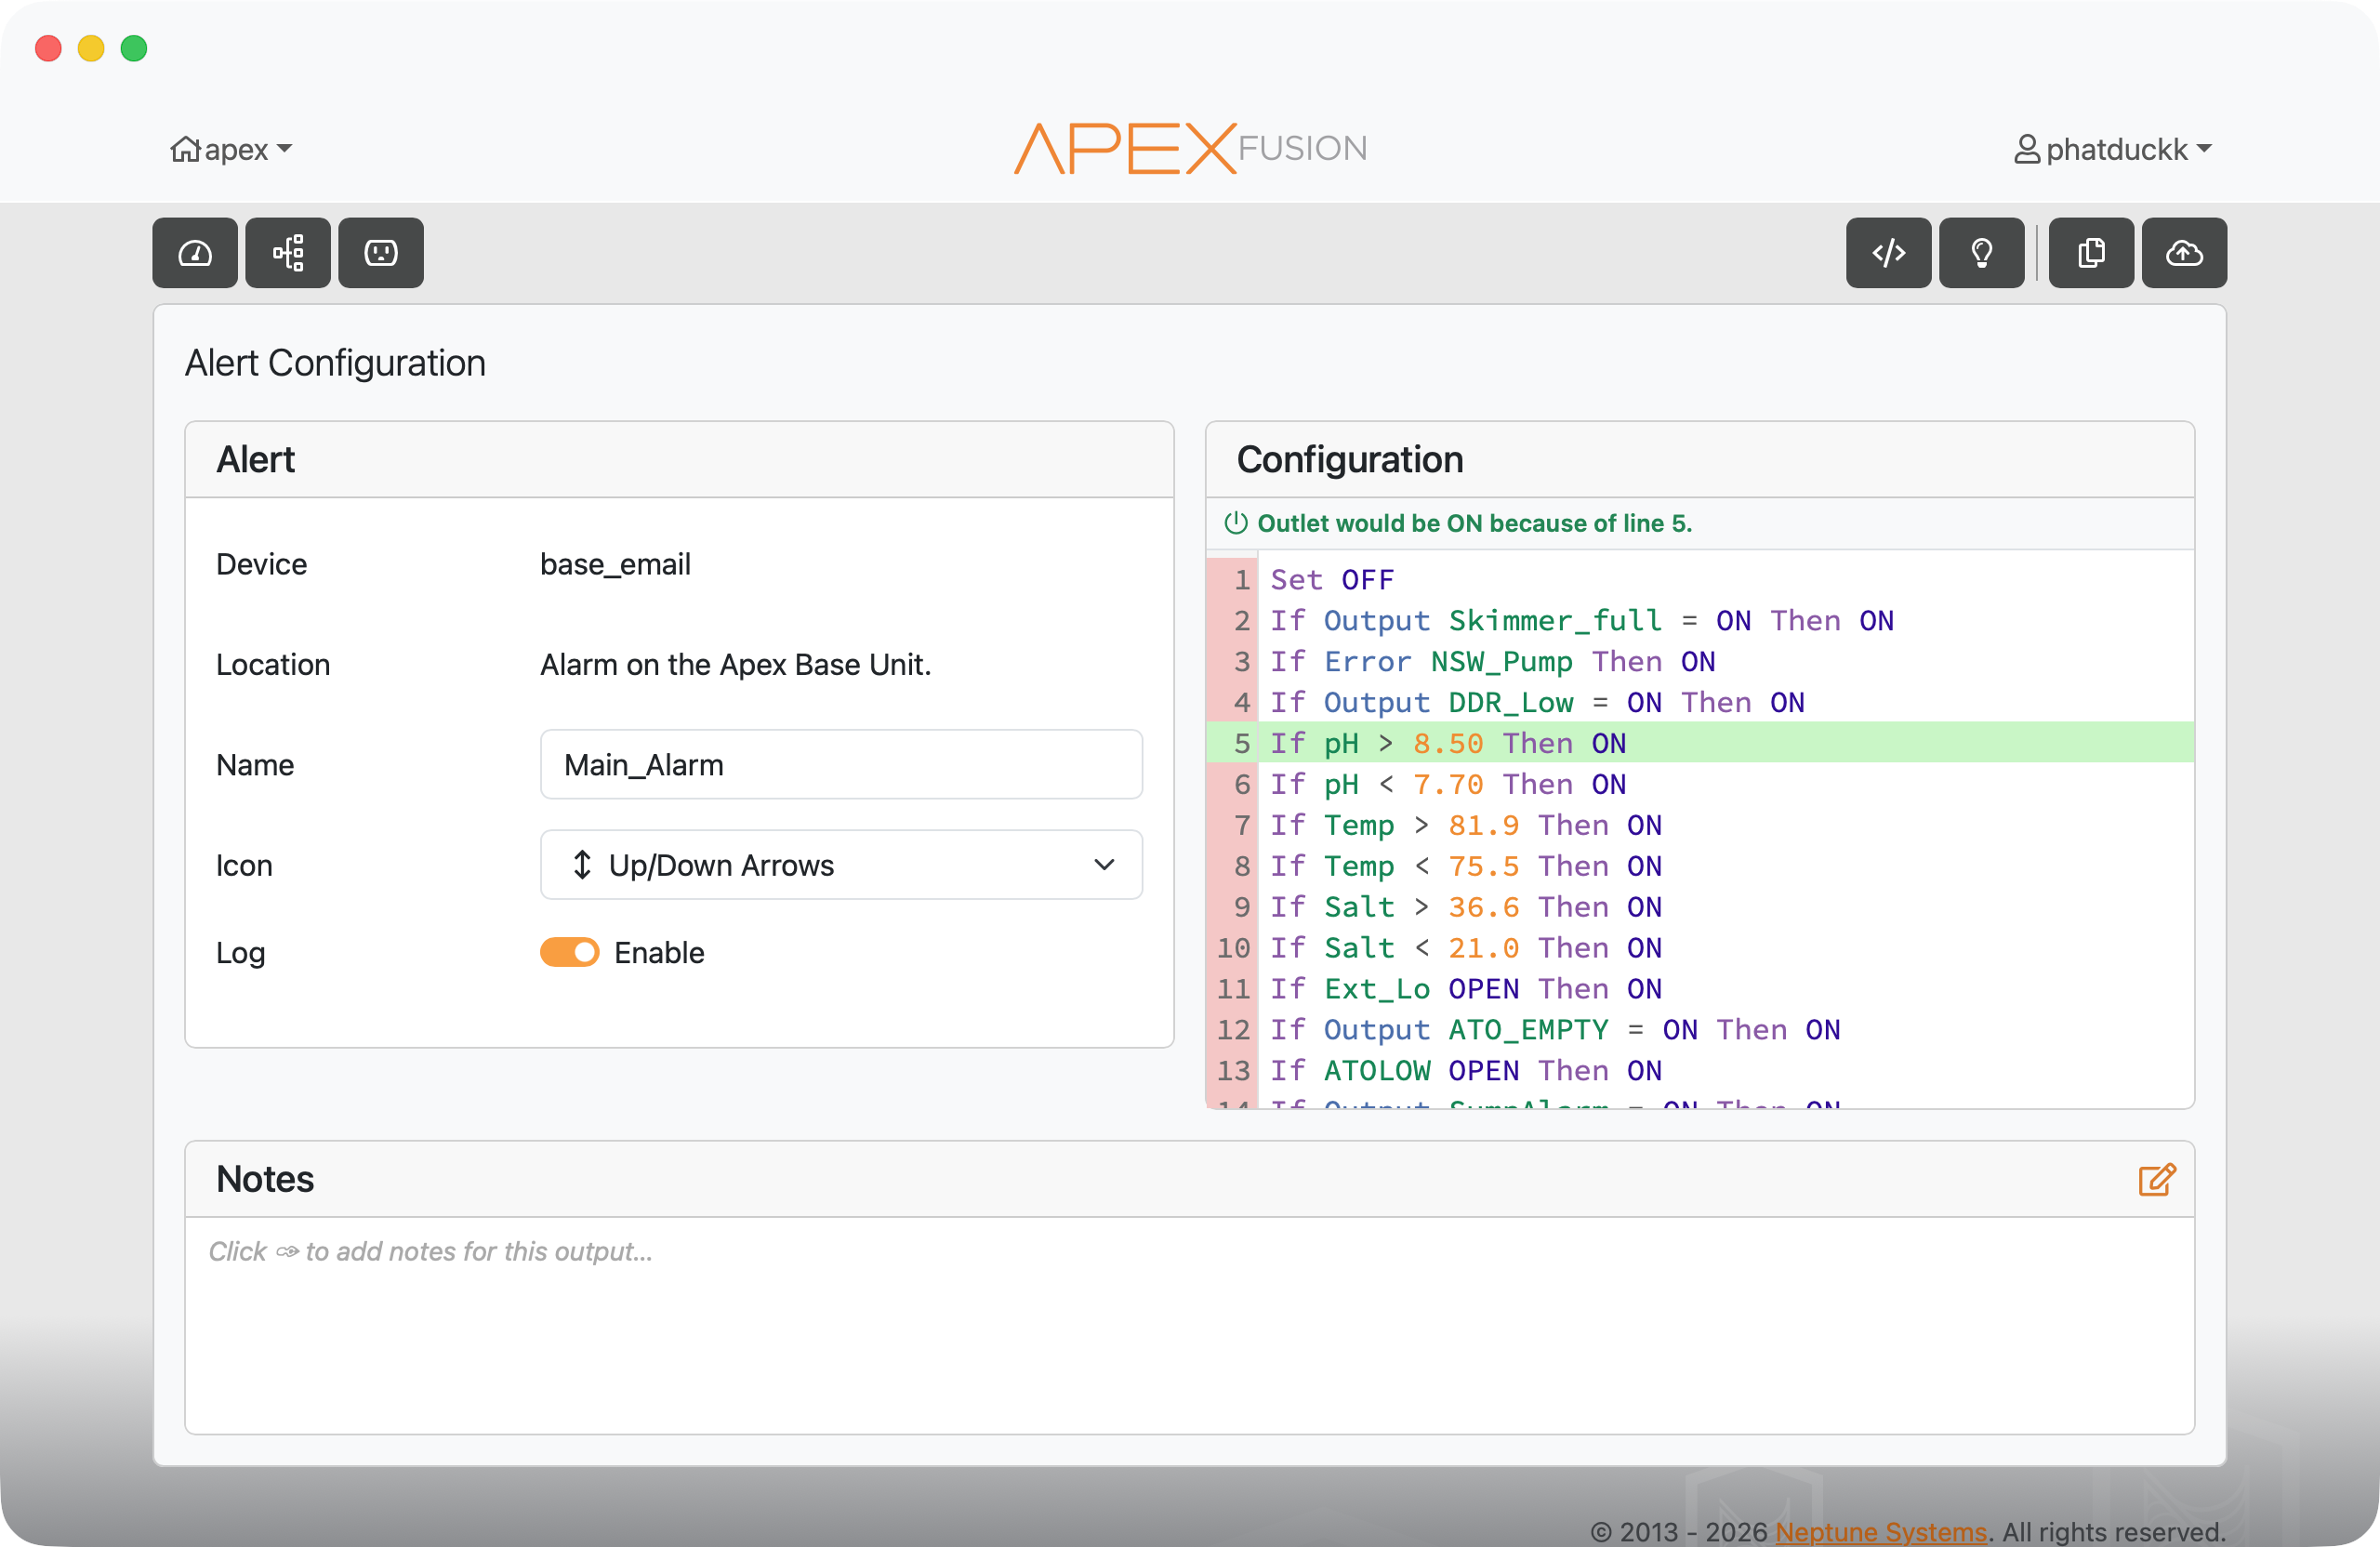
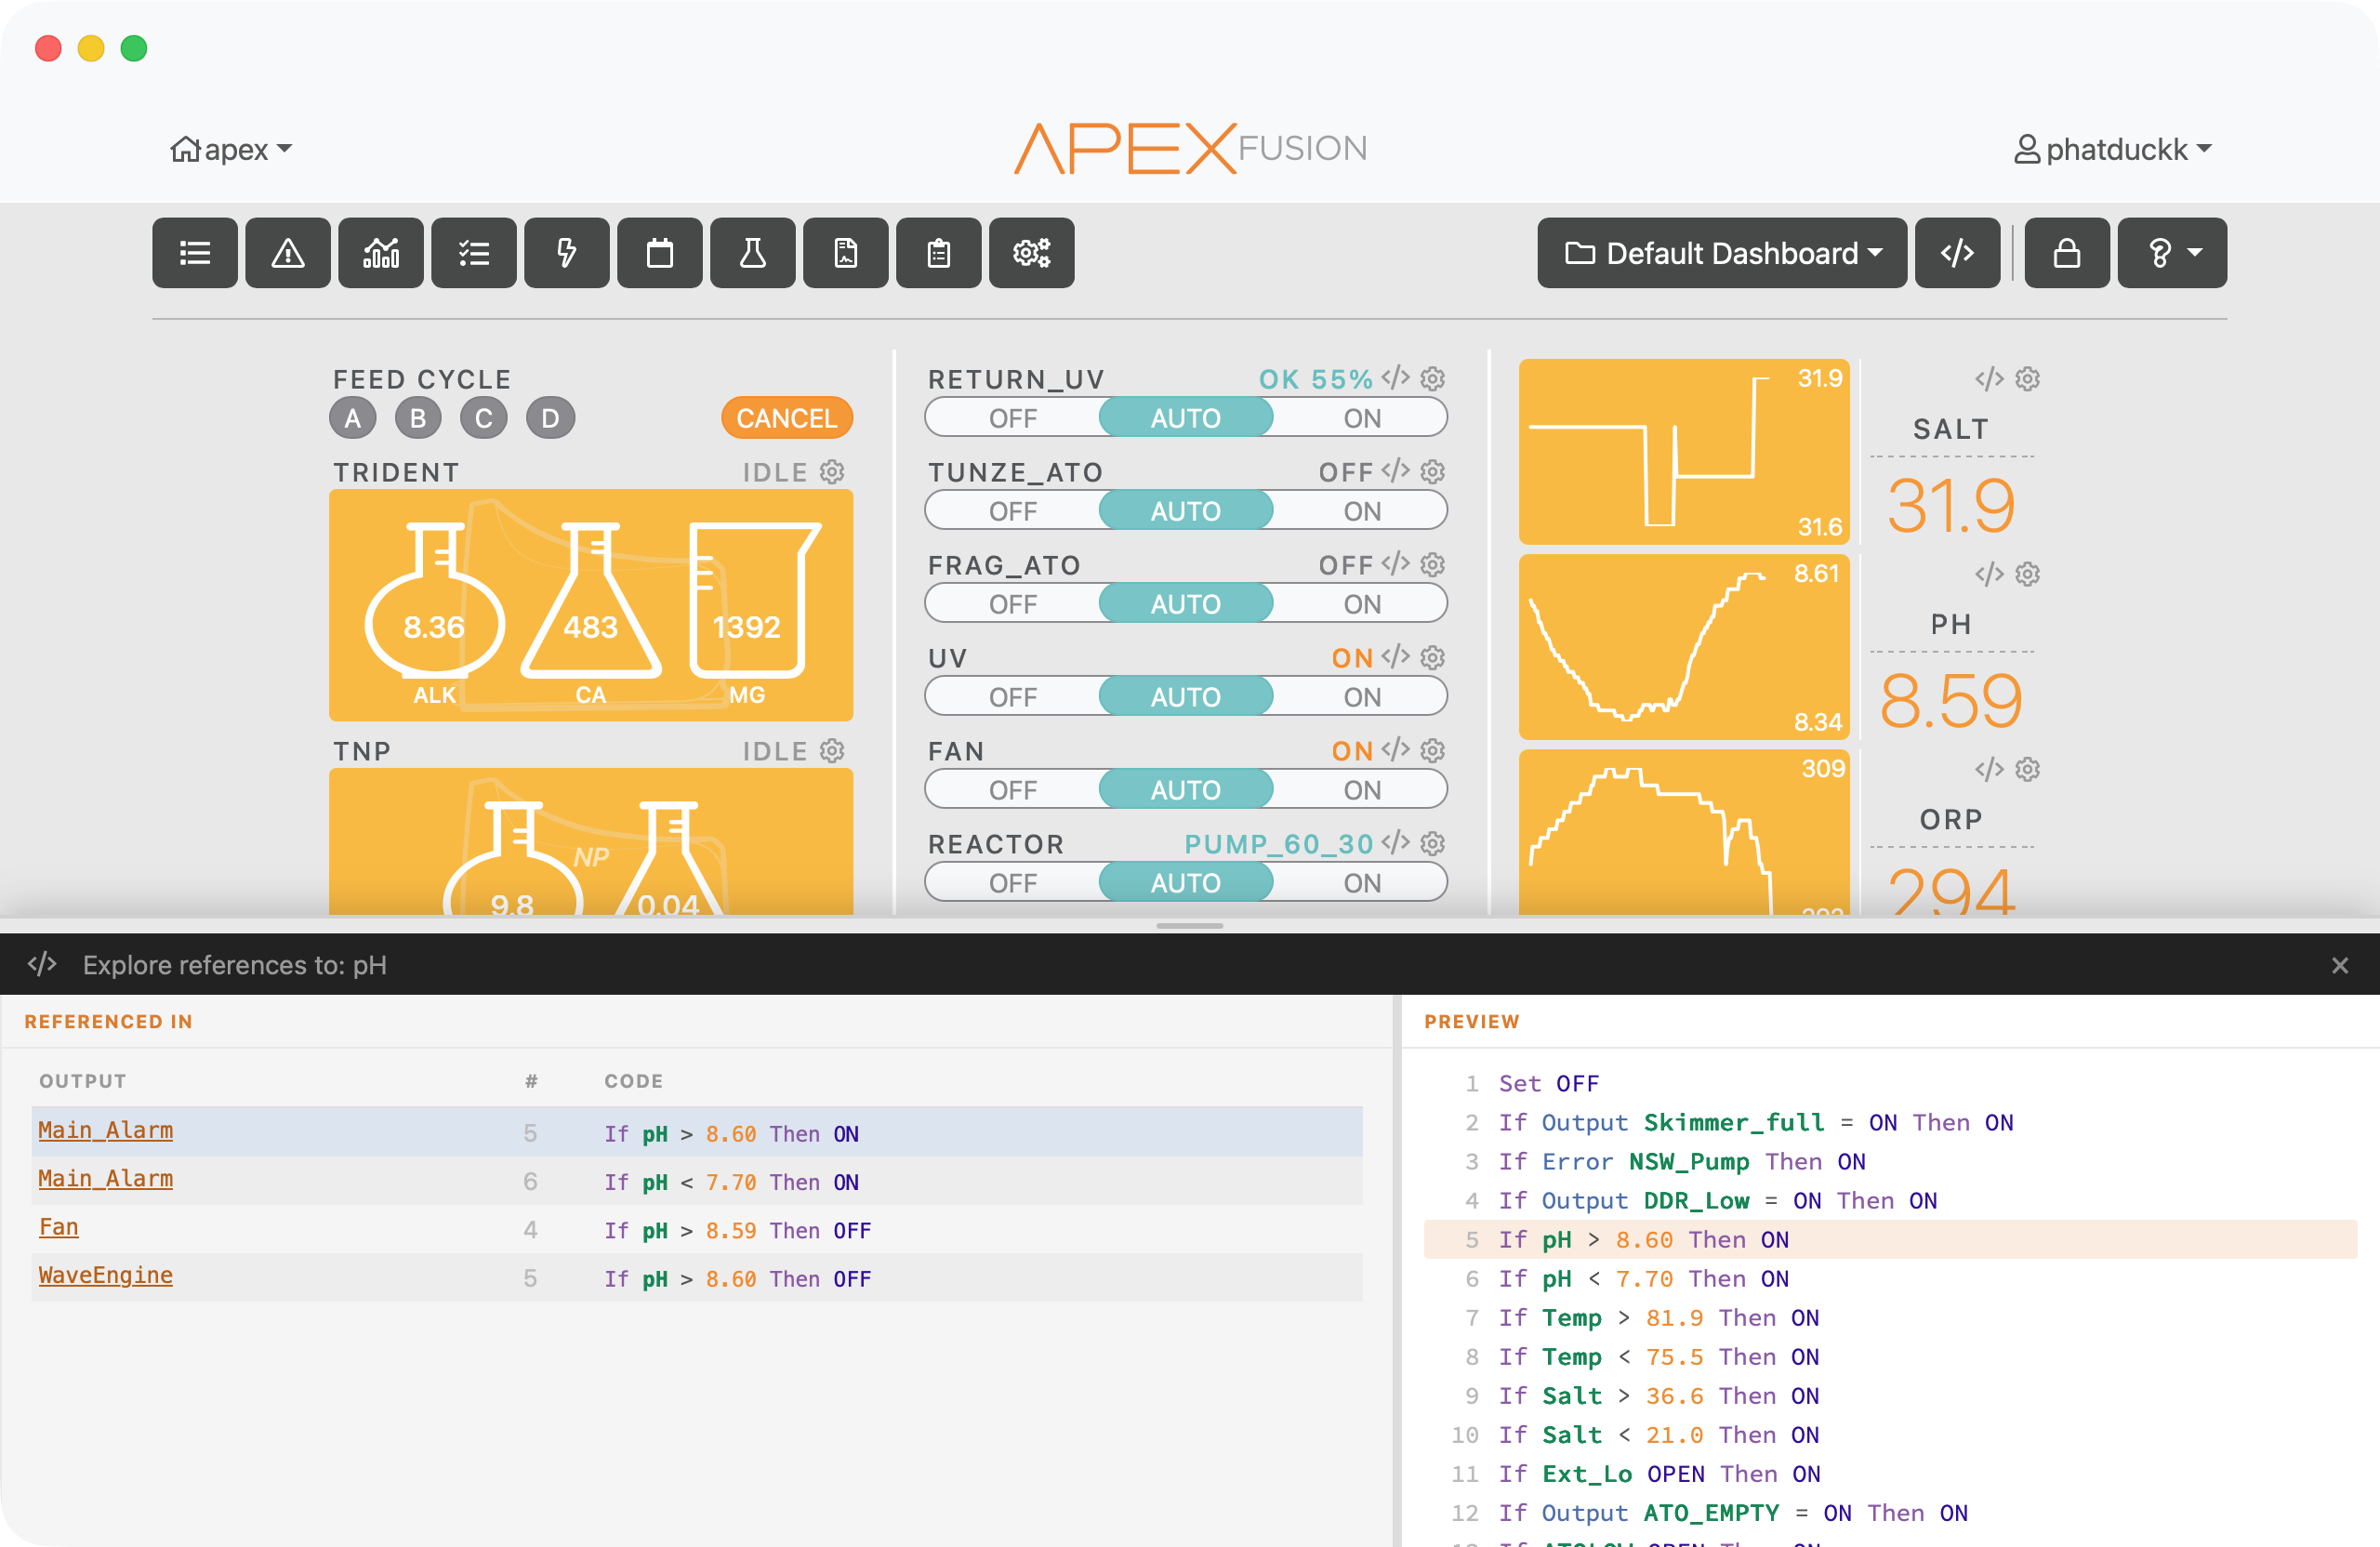
The answer, highlighted.

ABE highlights the line of code that's controlling the outlet's current state. No more guessing which condition is actually firing — the active line lights up so you know immediately.

Active line highlighted in code editor

Every line, evaluated.

The gutter next to each line shows how it was evaluated — true, false, a numeric value, whatever the expression resolved to. You can see the whole picture at once, not just the bottom line.

Gutter showing line evaluation results

Find out what's referencing what.

The full picture.

Open the reference explorer from the code icon on your dashboard to see every outlet, probe, and variable referenced across your whole setup. Search for anything and see everywhere it appears.

Reference explorer showing all references

SET, FALLBACK, and Feed Modes too.

The explorer doesn't just track probe and outlet references — it also shows you where SET and FALLBACK commands are used, and which outlets reference your Feed Modes. The stuff that's easy to lose track of.

Explorer showing SET, FALLBACK and Feed Mode references

Per-widget, right on the dashboard.

Each widget on your dashboard has a small code icon. Tap it to see references specific to that outlet — without opening the full explorer. Quick answers without leaving the dashboard.

Per-widget reference explorer